« お~い!竜馬 | メイン | gnuplot(7) »
2005年06月01日
gnuplot(6)
3次元グラフのカラー表示・等高線表示について。
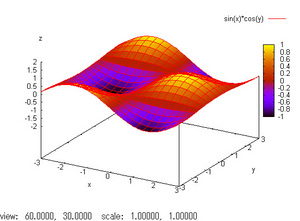
# sin(x)*cos(y) color

set xrange [-3:3]; set yrange [-3:3]; set zrange [-2:2]
set xlabel "x"; set ylabel "y"; set zlabel "z"
set isosample 20, 20
set pm3d
splot sin(x)*cos(y)
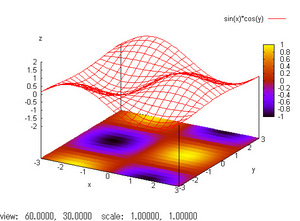
# sin(x)*cos(y) color at b

set xrange [-3:3]; set yrange [-3:3]; set zrange [-2:2]
set xlabel "x"; set ylabel "y"; set zlabel "z"
set isosample 20, 20
set pm3d at b
splot sin(x)*cos(y)
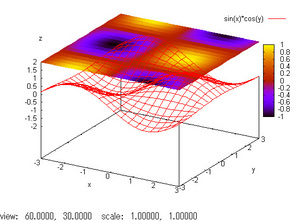
# sin(x)*cos(y) color at t

set xrange [-3:3]; set yrange [-3:3]; set zrange [-2:2]
set xlabel "x"; set ylabel "y"; set zlabel "z"
set isosample 20, 20
set pm3d at t
splot sin(x)*cos(y)
3パターンを示してみました。at b や at t オプションを使うことで等高線を上下面に分離可能です。普通に使う分には at b オプションの方が見やすいですね。
またここで isosample も設定していますが、これはメッシュのサンプル数を指定します。この値はデフォルトでは 10, 10 に設定されています。デフォルト設定の表示と比べてみて下さい。
投稿者 napier : 2005年06月01日 00:30
トラックバック
このエントリーのトラックバックURL:
http://will.squares.net/mt/mt-modified-tb.cgi/189
