« gnuplot(6) | メイン | 2005.06.02 »
2005年06月02日
gnuplot(7)
pm3d で指定するカラーのパターンは変更することができます。ここでは rgbformulae について示してみます。設定できる項目を gnuplot で調べるには以下のコマンドを入力します。
gnuplot> show palette rgbformulae

* there are 37 available rgb color mapping formulae:
 0: 0               1: 0.5             2: 1
 3: x               4: x^2             5: x^3
 6: x^4             7: sqrt(x)         8: sqrt(sqrt(x))
 9: sin(90x)       10: cos(90x)       11: |x-0.5|
12: (2x-1)^2       13: sin(180x)      14: |cos(180x)|
15: sin(360x)      16: cos(360x)      17: |sin(360x)|
18: |cos(360x)|    19: |sin(720x)|    20: |cos(720x)|
21: 3x             22: 3x-1           23: 3x-2
24: |3x-1|         25: |3x-2|         26: (3x-1)/2
27: (3x-2)/2       28: |(3x-1)/2|     29: |(3x-2)/2|
30: x/0.32-0.78125 31: 2*x-0.84       32: 4x;1;-2x+1.84;x/0.08-11.5
33: |2*x - 0.5|    34: 2*x            35: 2*x - 0.5
36: 2*x - 1
* negative numbers mean inverted=negative colour component
* thus the ranges in `set pm3d rgbformulae' are -36..36
カラーパターンの変更は set palette rgbformulae <r>,<g>,<b> で指定でき、rgb それぞれ 0~36 -36~36 まで指定可能です。この値はデフォルト値では 7,5,15 となっています。(追記)rgb の設定範囲が間違っていたのを修正しました。
仮にヘルプで示されている虹のパターンを示すと以下の様になります。
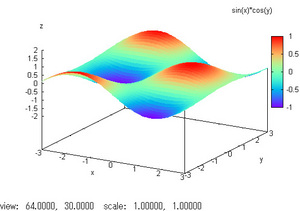
# sin_cos_pm3d

set xrange [-3:3]; set yrange [-3:3]; set zrange [-2:2]
set xlabel "x"; set ylabel "y"; set zlabel "z"
set isosample 40, 40
set pm3d
set palette rgbformulae 33,13,10
splot sin(x)*cos(y) with pm3d
投稿者 napier : 2005年06月02日 01:01
トラックバック
このエントリーのトラックバックURL:
http://will.squares.net/mt/mt-modified-tb.cgi/190
