2008年01月19日
Inkscape
- Inkscape 自由に描く。
http://www.inkscape.org/
EPS ファイルを編集するソフトを探していて行き着いたのが Inkscape です。Photoshop に対する GIMP のように、Illustrator に対しては Inkscape が位置しているようです。
ちょっと使ってみた感じ、自分が使いたい用途に対してはほぼ問題がなさそうです。Tgif を使おうとして Cygwin 環境を作ろうとしたり VMware を入れたりと大変でしたが、最終的にはいいソフトを見つけることができました。
ちょっと面倒なのは、このソフトは EPS ファイルの書き出しは可能なのですが入力ができないようなので SVG という形式に変換する必要があります。SVG に関してはこちら。
- Scalable Vector Graphics - Wikipedia
http://ja.wikipedia.org/wiki/Scalable_Vector_Graphics
この変換にはpstoedit を使っています。作業フローとしては plot data → gnuplot → EPS → pstoedit → SVG → Inkscape → EPS → pstoedit → WMF ですね。BAT ファイル経由でこの辺は怠惰に対応です。
eps2wmf.bat
  "C:\Program Files\pstoedit\pstoedit.exe" -f emf %1 %1.wmf
eps2svg.bat
  "C:\Program Files\pstoedit\pstoedit.exe" -f plot-svg %1 %1.svg
後はちゃんとプロットデータを作る部分。ポストエフェクトが可能になったので前工程が非常に楽になる気がします。
2007年12月28日
かぐやの軌道生データ
- かぐやの軌道生データが公開される
http://slashdot.jp/science/comments.pl?sid=384544...
/.J の「かぐやの軌道生データが公開される」でかぐやの軌道をプロットされている方がいました。わかっている方はすばやいですねぇ。
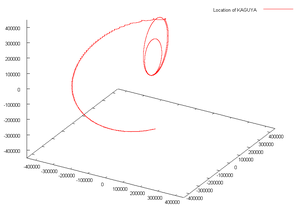
データは JAXA のサイトのこちらのページ。“月周回衛星「かぐや(SELENE)」クリティカルフェーズ軌道暦 (lzh形式)” というリンクです。
このプロットは /.J の plot そのものです。
set size square
set ticslevel 0

set xrange [-450000:450000]
set yrange [-450000:450000]
set zrange [-450000:450000]

splot '0709140216-0709142013.txt' u 2:3:4 every ::15 w l lt 1 notitle,\
      '0709142013-0709152300.txt' u 2:3:4 every ::15 w l lt 1 notitle,\
      '0709140216-0709142013.txt' u 2:3:4 every ::15 w l lt 1 notitle,\
      '0709142013-0709152300.txt' u 2:3:4 every ::15 w l lt 1 notitle,\
      '0709152300-0709180000.txt' u 2:3:4 every ::15 w l lt 1 notitle,\
      '0709180000-0709190056.txt' u 2:3:4 every ::15 w l lt 1 notitle,\
      '0709190056-0709200000.txt' u 2:3:4 every ::15 w l lt 1 notitle,\
      '0709200000-0709210100.txt' u 2:3:4 every ::15 w l lt 1 notitle,\
      '0709210100-0709220100.txt' u 2:3:4 every ::15 w l lt 1 notitle,\
      '0709220100-0709240000.txt' u 2:3:4 every ::15 w l lt 1 notitle,\
      '0709240000-0709250100.txt' u 2:3:4 every ::15 w l lt 1 notitle,\
      '0709250100-0709260000.txt' u 2:3:4 every ::15 w l lt 1 notitle,\
      '0709260000-0709280010.txt' u 2:3:4 every ::15 w l lt 1 notitle,\
      '0709280000-0709290258.txt' u 2:3:4 every ::15 w l lt 1 notitle,\
      '0709290258-0710020000.txt' u 2:3:4 every ::15 w l lt 1 notitle,\
      '0710020000-0710040000.txt' u 2:3:4 every ::15 w l lt 1 notitle,\
      '0710040000-0710052309.txt' u 2:3:4 every ::15 w l lt 1 notitle,\
      '0710052309-0710070000.txt' u 2:3:4 every ::15 w l lt 1 notitle,\
      '0710070000-0710081200.txt' u 2:3:4 every ::15 w l lt 1 notitle,\
      '0710081200-0710090042.txt' u 2:3:4 every ::15 w l lt 1 notitle,\
      '0710090042-0710101900.txt' u 2:3:4 every ::15 w l lt 1 notitle,\
      '0710101900-0710112200.txt' u 2:3:4 every ::15 w l lt 1 notitle,\
      '0710112200-0710130000.txt' u 2:3:4 every ::15 w l lt 1 notitle,\
      '0710130000-0710140436.txt' u 2:3:4 every ::15 w l lt 1 notitle,\
      '0710140436-0710150452.txt' u 2:3:4 every ::15 w l lt 1 notitle,\
      '0710150452-0710170000.txt' u 2:3:4 every ::15 w l lt 1 notitle,\
      '0710170000-0710171200.txt' u 2:3:4 every ::15 w l lt 1 notitle,\
      '0710171200-0710180752.txt' u 2:3:4 every ::15 w l lt 1 notitle,\
      '0710180752-0710191900.txt' u 2:3:4 every ::15 w l lt 1 ti "Location of KAGUYA"
コマンドの説明としては、u 2:3:4 で座標の指定、every ::15 でファイルの 15 行目からデータ開始という指定、といったところでしょうか。
2007年11月28日
陰線消去ミス?
新調した Vista マシンに環境設定をして、知らないうちに 2000 の環境と異なった gnuplot version 4.2.2 を使っていました。 2000 で使っていたのは version 4.0 です。
- SourceForge.net: Files
http://sourceforge.net/project/showfiles.php?group_id=2055
忙しさも峠を越したのでそろそろと・・・と思い、いろいろ実験をし始めたのですが、どうも 4.2.2 には陰線消去が失敗するようです。適当にサンプルを探していたときに以下のサイトを見つけて、
- Gnuplot-Grundkurs
http://userpage.fu-berlin.de/~voelker/gnuplotkurs/gnuplotkurs.html
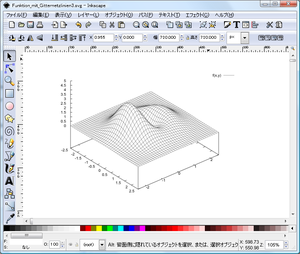
そこにあった "3D-Plot einer Funktion mit Gitternetzlinien" をプロットしてみたところ、4.0 と 4.2.2 で次のような差が見られます。4.2.2 では極大部周辺で陰線が消えきっておらず、ノイズのように緑の点が見えます。
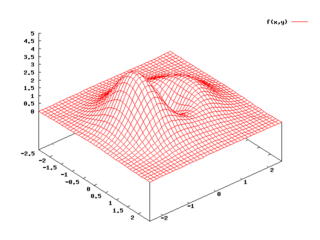 | 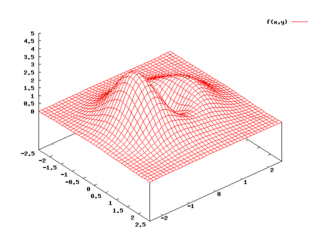 |
| ver. 4.0 | ver. 4.2.2 |
ちなみに plt は以下のように png ファイルへの書き出しを追加しています。
set hidden3d
set isosamples 40
set xrange [-2.5:2.5]
set yrange [-2.5:2.5]
set zrange [0.0:5.0]
set xtics 0.5
set ytics 1.0
set ztics 0.5
set view 40,50,1.0,1.5
f(x,y)=(x**2+2.5*y**2-y)*exp(1-(x**2+y**2))
set term png
set out "Funktion_mit_Gitternetzlinien.png"
splot f(x,y)
現在は version 4.3 が開発中のようで、そこでは depth sorting + transparency がサポートされるみたいです。
- Demo scripts for gnuplot CVS version
http://gnuplot.sourceforge.net/demo_4.3/index2.html
これにはちょっと期待しますね。オフラインレンダリングなので画質向上はぜひ行ってほしいです(^^)
2006年04月11日
gnuplot(10)
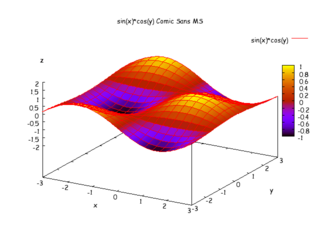
ひさびさの gnuplot ネタです。.plt ファイルを組んで画像保存をする必要があった場合のコマンドです。これは知らないと意外と不便です(実際、今まで私は PrintScreen でキャプチャしてました)。
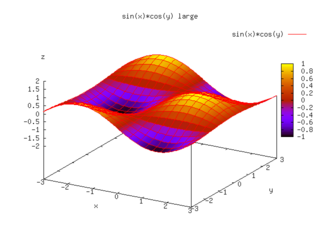
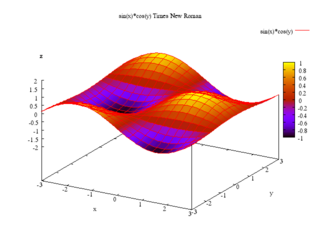
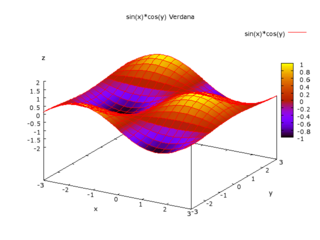
sin_cos_color_Comic_Snas_MS.plt
# sin(x)*cos(y) color Comic Sans MS

set xrange [-3:3]; set yrange [-3:3]; set zrange [-2:2]
set xlabel "x"; set ylabel "y"; set zlabel "z"
set isosample 20, 20
set pm3d
splot sin(x)*cos(y)
set terminal png font "Comic Sans MS" 10 size 640,480
set output "sin_cos_Comic_Sans_MS.png"
set title "sin(x)*cos(y) Comic Sans MS"
replot
set output
# sin(x)*cos(y) color large

set xrange [-3:3]; set yrange [-3:3]; set zrange [-2:2]
set xlabel "x"; set ylabel "y"; set zlabel "z"
set isosample 20, 20
set pm3d
splot sin(x)*cos(y)
set terminal png large size 640,480
set output "sin_cos_large.png"
set title "sin(x)*cos(y) large"
replot
set output
sin_cos_color_Times_New_Roman.plt
# sin(x)*cos(y) color Times New Roman

set xrange [-3:3]; set yrange [-3:3]; set zrange [-2:2]
set xlabel "x"; set ylabel "y"; set zlabel "z"
set isosample 20, 20
set pm3d
splot sin(x)*cos(y)
set terminal png font "Times New Roman" 10 size 640,480
set output "sin_cos_Times_New_Roman.png"
set title "sin(x)*cos(y) Times New Roman"
replot
set output
# sin(x)*cos(y) color Verdana

set xrange [-3:3]; set yrange [-3:3]; set zrange [-2:2]
set xlabel "x"; set ylabel "y"; set zlabel "z"
set isosample 20, 20
set pm3d
splot sin(x)*cos(y)
set terminal png font "Verdana" 10 size 640,480
set output "sin_cos_Verdana.png"
set title "sin(x)*cos(y) Verdana"
replot
set output
4 種類をサンプルとして作ってみました。これらはフォントの指定のみが異なっています。が、あまり TrueType フォントはきれいじゃないですね。オリジナルのフォントとしては tiny (5x8 ピクセル), small (6x12 ピクセル), medium, (7x13 Bold), large (8x16), giant (9x15 ピクセル) が存在しますのでそれから選択する方がよさそうです。詳しくは gnuplot> help set term でヘルプを参照してください。このヘルプは本当によく出来ていると思います。
また、これで作られる png 画像のサイズは 640x480 ですが、それは size 640,480 という指定で行われています。このサイズ指定の方法もなかなか探すことが出来ませんでした。ヘルプを確認してからは「Windows 環境での gnuplot に関しては web resource よりもヘルプだ」と思い直しています。
使いこなす gnuplot という書籍ももっているのですがやはり unix 環境に関する記述が多く、特に画像保存の方法に関しては苦労しました。PS や eps など TeX 環境で使うわけでもなく web で使う方が多いからです。
2005年06月07日
gnuplot(9)
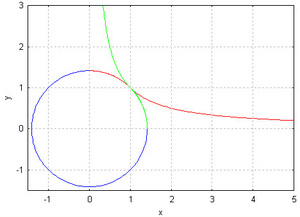
円と直角双曲線です。
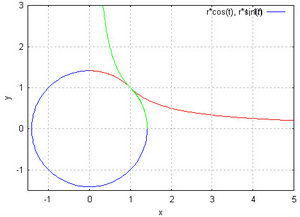
# circle.plt

set parametric
set multiplot
set key on
set grid
set xtics 1; set ytics 1
set xrange [-1.5:5]; set yrange [-1.5:3]
set xlabel "x"; set ylabel "y"; set zlabel "z"
r = sqrt(2)
plot [pi/4:pi/2] r*cos(t),r*sin(t) lt 1
plot [1:5] t,1/t lt 1
plot [0:pi/4] r*cos(t),r*sin(t) lt 2
plot [0:1] t,1/t lt 2
plot [pi/2:2*pi] r*cos(t),r*sin(t) lt 3
ここでは multiplot を使用しています。これは複数の図を重ねて表示するためのモードですが、式なども文字が重なって表示されてしまう問題があります。これを表示させなくするためには set key off コマンドを使います。
# circle2.plt

set parametric
set multiplot
set key off
set grid
set xtics 1; set ytics 1
set xrange [-1.5:5]; set yrange [-1.5:3]
set xlabel "x"; set ylabel "y"; set zlabel "z"
r = sqrt(2)
plot [pi/4:pi/2] r*cos(t),r*sin(t) lt 1
plot [1:5] t,1/t lt 1
plot [0:pi/4] r*cos(t),r*sin(t) lt 2
plot [0:1] t,1/t lt 2
plot [pi/2:2*pi] r*cos(t),r*sin(t) lt 3
またここでは媒介変数モードとして set parametric を指定しています。二次元グラフを作成する媒介変数モードでは t が割り当てられます。さらに変数として r を使っています。変数を使うためには単に 変数 = 値 で OK です。
図としては何でもない円と直角双曲線ですが、それぞれ t の値で色を変えています。この色分けをしたかったために set multiplot のモードにしています。
2005年06月03日
gnuplot(8)
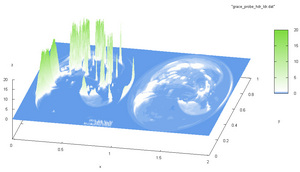
syoyoさんとこに触発された、HDR と LDR の比較表示です。gnuplot を使おうと思った理由の1つです。オリジナル画像ファイルはこちらです。
# grace_probe_hdr_ldr.plt

set xrange [0:2]; set yrange [0:1]; set zrange [0:20]
set xlabel "x"; set ylabel "y"; set zlabel "z"
set parametric
set pm3d
set palette defined (0 "#649de9", 1 "#ffffff", 30 "#7ddb3d" )
splot "grace_probe_hdr_ldr.dat" with pm3d
データファイルが大きすぎる&まだ HDR イメージのロード処理が適当すぎる&トーンマップせず jpg ファイルを LDR 画像として使っている、等ありデータファイルのリンクはありません(gnuplotの覚書が目的ですし)。
LDR は [0.0,1.0] の範囲であり、HDR とはレンジが違いすぎるのでカラーの変化を極端にしてあります。ここでの新しいオプションは defined(,,,) です。LDRレンジで一度 white にしています。rgbformulae でなんとかしようと思ったんですが難しいですね。小さい値における高周波関数がないのでうまくいきませんでした。sqrt(sqrt(x))や|sin(720x)|でなんとかできるかなと思ったんですが、直値指定のほうがいいですね。
このグラフでは set parametric は必要ないですね。いろいろ実験中だったんでそのまま残してしまってました(2005.06.06)。
2005年06月02日
gnuplot(7)
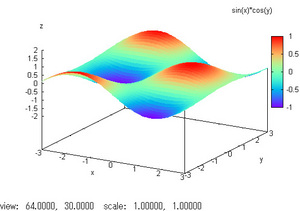
pm3d で指定するカラーのパターンは変更することができます。ここでは rgbformulae について示してみます。設定できる項目を gnuplot で調べるには以下のコマンドを入力します。
gnuplot> show palette rgbformulae

* there are 37 available rgb color mapping formulae:
 0: 0               1: 0.5             2: 1
 3: x               4: x^2             5: x^3
 6: x^4             7: sqrt(x)         8: sqrt(sqrt(x))
 9: sin(90x)       10: cos(90x)       11: |x-0.5|
12: (2x-1)^2       13: sin(180x)      14: |cos(180x)|
15: sin(360x)      16: cos(360x)      17: |sin(360x)|
18: |cos(360x)|    19: |sin(720x)|    20: |cos(720x)|
21: 3x             22: 3x-1           23: 3x-2
24: |3x-1|         25: |3x-2|         26: (3x-1)/2
27: (3x-2)/2       28: |(3x-1)/2|     29: |(3x-2)/2|
30: x/0.32-0.78125 31: 2*x-0.84       32: 4x;1;-2x+1.84;x/0.08-11.5
33: |2*x - 0.5|    34: 2*x            35: 2*x - 0.5
36: 2*x - 1
* negative numbers mean inverted=negative colour component
* thus the ranges in `set pm3d rgbformulae' are -36..36
カラーパターンの変更は set palette rgbformulae <r>,<g>,<b> で指定でき、rgb それぞれ 0~36 -36~36 まで指定可能です。この値はデフォルト値では 7,5,15 となっています。(追記)rgb の設定範囲が間違っていたのを修正しました。
仮にヘルプで示されている虹のパターンを示すと以下の様になります。
# sin_cos_pm3d

set xrange [-3:3]; set yrange [-3:3]; set zrange [-2:2]
set xlabel "x"; set ylabel "y"; set zlabel "z"
set isosample 40, 40
set pm3d
set palette rgbformulae 33,13,10
splot sin(x)*cos(y) with pm3d
2005年06月01日
gnuplot(6)
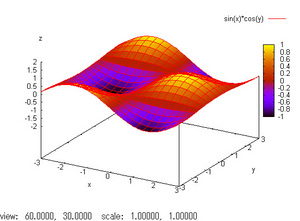
3次元グラフのカラー表示・等高線表示について。
# sin(x)*cos(y) color

set xrange [-3:3]; set yrange [-3:3]; set zrange [-2:2]
set xlabel "x"; set ylabel "y"; set zlabel "z"
set isosample 20, 20
set pm3d
splot sin(x)*cos(y)
# sin(x)*cos(y) color at b

set xrange [-3:3]; set yrange [-3:3]; set zrange [-2:2]
set xlabel "x"; set ylabel "y"; set zlabel "z"
set isosample 20, 20
set pm3d at b
splot sin(x)*cos(y)
# sin(x)*cos(y) color at t

set xrange [-3:3]; set yrange [-3:3]; set zrange [-2:2]
set xlabel "x"; set ylabel "y"; set zlabel "z"
set isosample 20, 20
set pm3d at t
splot sin(x)*cos(y)
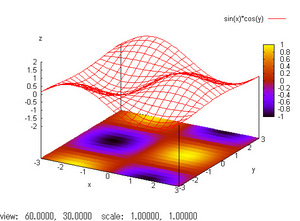
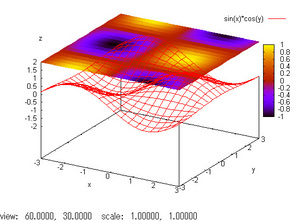
3パターンを示してみました。at b や at t オプションを使うことで等高線を上下面に分離可能です。普通に使う分には at b オプションの方が見やすいですね。
またここで isosample も設定していますが、これはメッシュのサンプル数を指定します。この値はデフォルトでは 10, 10 に設定されています。デフォルト設定の表示と比べてみて下さい。

